Case Study
SanDisk Complete Trade Cycle: $2,340 Top to $1,500 Crash to $1,933 Sell Signal to New Crash Alert
A publicly timestamped stateful trading cycle documenting accumulation, distribution, reaccumulation, rally and a new active downside signal in SanDisk.
Historical case study — editorial context added 28 September 2026. Original claims and dates are preserved below. This is not a current signal or a representative performance result. Four algorithmic signals identified four structural transitions across one continuous SanDisk trade cycle. The sequence began with a Strong Buy near $580, progressed to a Sell & Short signal at $2,340, reversed to a reiterated Strong Buy near $1,500 and completed the latest rally with a real-time Sell signal at $1,933. The next downside phase is already published as an active forecast. Every signal was posted before the corresponding price movement through the public record on X and LinkedIn.
The $10M Accuracy Challenge remains open. The completed portions of this cycle are presented as a public record, while the latest downside leg remains prospective.
← Back to Case StudiesFour algorithmic signals. Four structural turns. Zero missed calls.
This case study documents one continuous SanDisk trading cycle in which each signal exited the prior phase and established the next directional position.
Case-Study Introduction
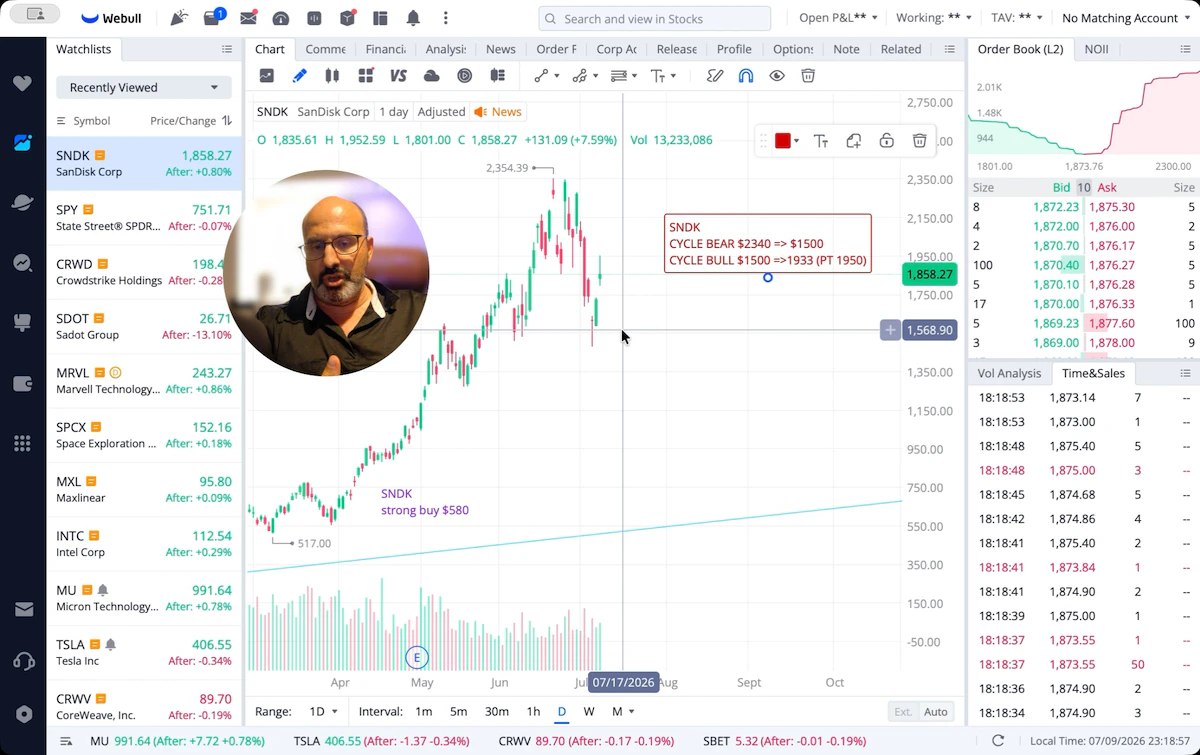
This case study documents the complete SanDisk trade cycle from the $580 Strong Buy through the $2,340 cycle top, the subsequent decline toward $1,500, the reiterated Strong Buy at $1,500, the recovery toward $1,933, the real-time Sell at $1,933 and the newly active downside forecast.
Every signal was published before the corresponding price move. The record is timestamped publicly, and this analysis is not a retrospective reconstruction. The latest downside leg is a forecast, not a completed outcome.
Nothing in the completed portions of this cycle depends on hindsight or post-event revision.
The next downside leg remains an active forecast and should be evaluated prospectively against future market prices.
Source context is available through the public @realalexvieira record on X and the associated product and publication records. LinkedIn timestamps are referenced generically where exact public URLs are not available in this repository.
Executive Summary
- Asset: SanDisk
- Ticker: SNDK
- Original accumulation signal: Strong Buy near $580
- Distribution signal: Sell & Short at $2,340
- Signal date: June 23, 2026
- Subsequent decline: approximately $1,500
- Reaccumulation signal: reiterated Strong Buy at approximately $1,500
- Price target: $1,950
- Confidence score: 98, subject to verification against the original signal record
- Subsequent recovery: approximately $1,933
- Latest signal: real-time Sell at $1,933
- Current status: cycle inversion active
- Next forecast: new downside phase; active, not completed
- Verification: public timestamps on X and LinkedIn, subject to source availability
- Publication date: July 10, 2026
The Complete SanDisk Trade Cycle
Four Signals Across One Continuous Stateful Market Cycle
-
Phase 1 — Strong Buy at $580
- Signal: Strong Buy
- Level: approximately $580
- Market phase: early accumulation
- Status: publicly timestamped
- Purpose: entry into the developing memory-stock cycle
This established the initial state later used by the system when evaluating subsequent cycle transitions.
-
Phase 2 — Sell & Short at $2,340
- Signal: Sell & Short
- Level: $2,340
- Date: June 23, 2026
- Market phase: distribution
- Status: published before the decline
This signal exited the prior bullish leg, inverted the directional thesis and initiated the bearish leg. The $2,340 signal identified the cycle-top region before the subsequent decline; it is not described as the exact absolute top without a confirmed session high.
-
Phase 3 — Decline Toward $1,500
- Prior sell level: $2,340
- Subsequent reference price: approximately $1,500
- Approximate decline: 35.9%
($2,340 − $1,500) ÷ $2,340 × 100 = 35.90%. This bearish leg confirmed the preceding distribution signal.
-
Phase 4 — Reiterated Strong Buy at $1,500
- Signal: Reiterated Strong Buy
- Level: approximately $1,500
- Price target: $1,950
- Confidence: 98, subject to verification
- Market phase: reaccumulation or tactical cycle reversal
The algorithm reversed the prior bearish thesis after the decline reached the new accumulation region.
-
Phase 5 — Rally Toward $1,933
- Buy reference: approximately $1,500
- Rally reference: approximately $1,933
- Approximate gain: 28.9%
- Price target: $1,950
- Percentage of target reached: approximately 99.1%
($1,933 − $1,500) ÷ $1,500 × 100 = 28.87%. $1,933 ÷ $1,950 × 100 = 99.13%. The rally advanced to within $17 of the published $1,950 objective; the target is not described as hit.
-
Phase 6 — Real-Time Sell at $1,933
- Signal: Sell
- Level: $1,933
- Market phase: cycle inversion
- Status: issued in real time
- Direction: downside
This signal closed the preceding bullish leg, shifted the system back to a bearish state and activated a new downside forecast.
-
Phase 7 — New Crash Forecast Active
- Forecast status: Active
- Outcome: not yet completed as of July 10, 2026
The next downside leg has been published but had not yet completed as of the case-study publication date. It is not verified performance and no outcome is calculated here.
Signal Summary Table
| Sequence | Signal | Reference Level | Market Phase | Status |
|---|---|---|---|---|
| 1 | Strong Buy | $580 | Accumulation | Completed |
| 2 | Sell & Short | $2,340 | Distribution | Completed |
| 3 | Reiterated Strong Buy | $1,500 | Reaccumulation | Completed |
| 4 | Sell | $1,933 | Cycle inversion | Active signal |
| 5 | New downside forecast | Not yet completed | Forecast | Active |
The four algorithmic signals are the Strong Buy at $580, Sell & Short at $2,340, reiterated Strong Buy at $1,500 and Sell at $1,933. The decline and rally are market outcomes, not separate signals. The active forecast is the forward-looking consequence of signal four unless a separate fifth signal is later documented.
Why This Case Study Matters
Stateful Architecture Is the Difference
The SanDisk sequence is a documented example of stateful trade-cycle management. Each signal was not an isolated forecast. It was both the exit from the preceding phase and the entry into the next.
A complete trade cycle requires the system to retain prior entry state, prior exit state, active directional thesis, target history, price-target revisions, memory-sector context, correlated asset state, portfolio exposure, cycle progression and reversal conditions.
Stateful vs. Stateless Architecture
Stateless Signal Generation
A stateless implementation generally evaluates the current prompt, current market snapshot, current ticker or current request. A purely stateless implementation without external persistent memory cannot maintain the continuous position history required by the cycle documented here. This does not claim that no stateless system can ever be engineered to use external state.
- It does not inherently retain prior position ownership.
- It does not inherently retain prior target levels or previous thesis inversions.
- It does not inherently retain portfolio-level exposure or connected trade-cycle history.
Stateful Trade-Cycle Management
Intuitive Code’s stateful architecture retains the prior state of the position and uses it in subsequent decisions. Every new SanDisk signal is evaluated in the context of the prior SanDisk signal.
The memory-complex state can include SanDisk, Micron, Seagate, SK hynix, sector-level capital rotation and correlated cycle transitions. Proprietary implementation details are not disclosed here.
Stateful Mesh Trading Across the Memory Complex
SanDisk is not evaluated in isolation. The agent maintains contextual state across SanDisk, Micron, Seagate and SK hynix to identify sector accumulation, coordinated expansion, distribution, capital rotation and cycle inversion.
The SanDisk cycle forms part of a wider memory-complex decision mesh rather than a sequence of disconnected ticker forecasts. See the related stateful memory-stock case study for the broader basket context.
Documented Signal Consistency Across Multiple Assets
The $1,500 reiterated Strong Buy carried a reported confidence score of 98, subject to verification against the original signal record. This is a signal confidence score, not a claim of 98% historical accuracy.
Completed historical examples should be read as individual public records rather than as a blanket accuracy statistic. The algorithmic signals frequently diverged from prevailing analyst positioning.
Cross-Asset Track Record
- Palantir and related multi-asset signals — the existing record documents public SPY, MU, PLTR, SNDK and RGC signals without adding an unsupported accuracy label.
- Pinduoduo and Micron — a documented PDD $26-to-$153 cycle and capital rotation into Micron near $67.
- Micron and SanDisk — the existing case study records MU near $67, SanDisk near $580 and other documented trade-cycle levels.
- Netflix and NVIDIA — the record describes Netflix near $76, a later $96 reference within 72 hours and an NVIDIA $202 exit.
- NVIDIA — the existing case study documents a sell near $202 followed by a decline toward $177.
- Duolingo — the existing record documents a sell/bubble-top reference near $544 and a later decline, without converting it into an unsupported accuracy label.
- MARA — a public short near $30.50 and later reference near $6.66.
- IBM — a sell at $323 before the documented decline toward $217.58.
$10M Accuracy Challenge
The $10M Accuracy Challenge remains open. No challenge hyperlink is added because this repository does not contain a dedicated challenge destination.
Public Verification and Independent Audit
The case study may be verified through public X posts from @realalexvieira, LinkedIn publication timestamps, the video publication timestamp, historical SNDK market prices, product records from the free plan, source screenshots or archived records where present, and the publication date of each signal.
Every completed signal described here was published before the corresponding price movement. The record is independently auditable; this page does not claim that an external audit has already occurred.
The completed, verified legs are distinct from the current active Sell signal and from the still-unresolved downside forecast.
Methodology
Mathematical Convergence
The algorithm evaluates convergence across multiple quantitative conditions and persistent position state. This case study describes the observed sequence without inventing formulas or proprietary indicators.
Accumulation and Distribution
Accumulation → Expansion → Distribution → Decline → Reaccumulation → Rally → Cycle Inversion
Applied to SanDisk: accumulation near $580, distribution near $2,340, decline toward $1,500, reaccumulation near $1,500, rally toward $1,933 and renewed cycle inversion at $1,933.
Stateful Thesis Inversion
A stateful system must terminate the prior thesis, record the completed outcome, establish the next directional state and retain the entire sequence for future decisions.
Related Thesis and Further Reading
The broader thesis is developed in “One Verified AI Trading Signal to Fund the Next Ten Years of Your Life”.
- All case studies
- Insights
- Lessons and videos
- Forecasts
- Products
- Autonomous Trading login
- Stateful AI Trading Strategist
- AI memory-stock case study
- Stateful Trading Agent memory-complex case study
- One-to-Many Meshed Networking™ masterclass
- Stateful Decision Intelligence
- Personal AI Trading Agents
Disclaimer
This content is provided for educational and informational purposes only. It does not constitute investment advice, an offer or a recommendation to buy or sell any security.
Documented historical signals do not guarantee future performance. Active forecasts may not occur. Trading involves substantial risk, and past performance does not indicate future results.
Readers should conduct independent research and assess their own financial position and risk tolerance.
The new downside forecast described in this case study was active as of July 10, 2026 and had not yet been confirmed as a completed market outcome.