Case Study
SpaceX (SPCX) $150 to $229 to $172 — The Complete IPO Cycle While Wall Street Targeted $400
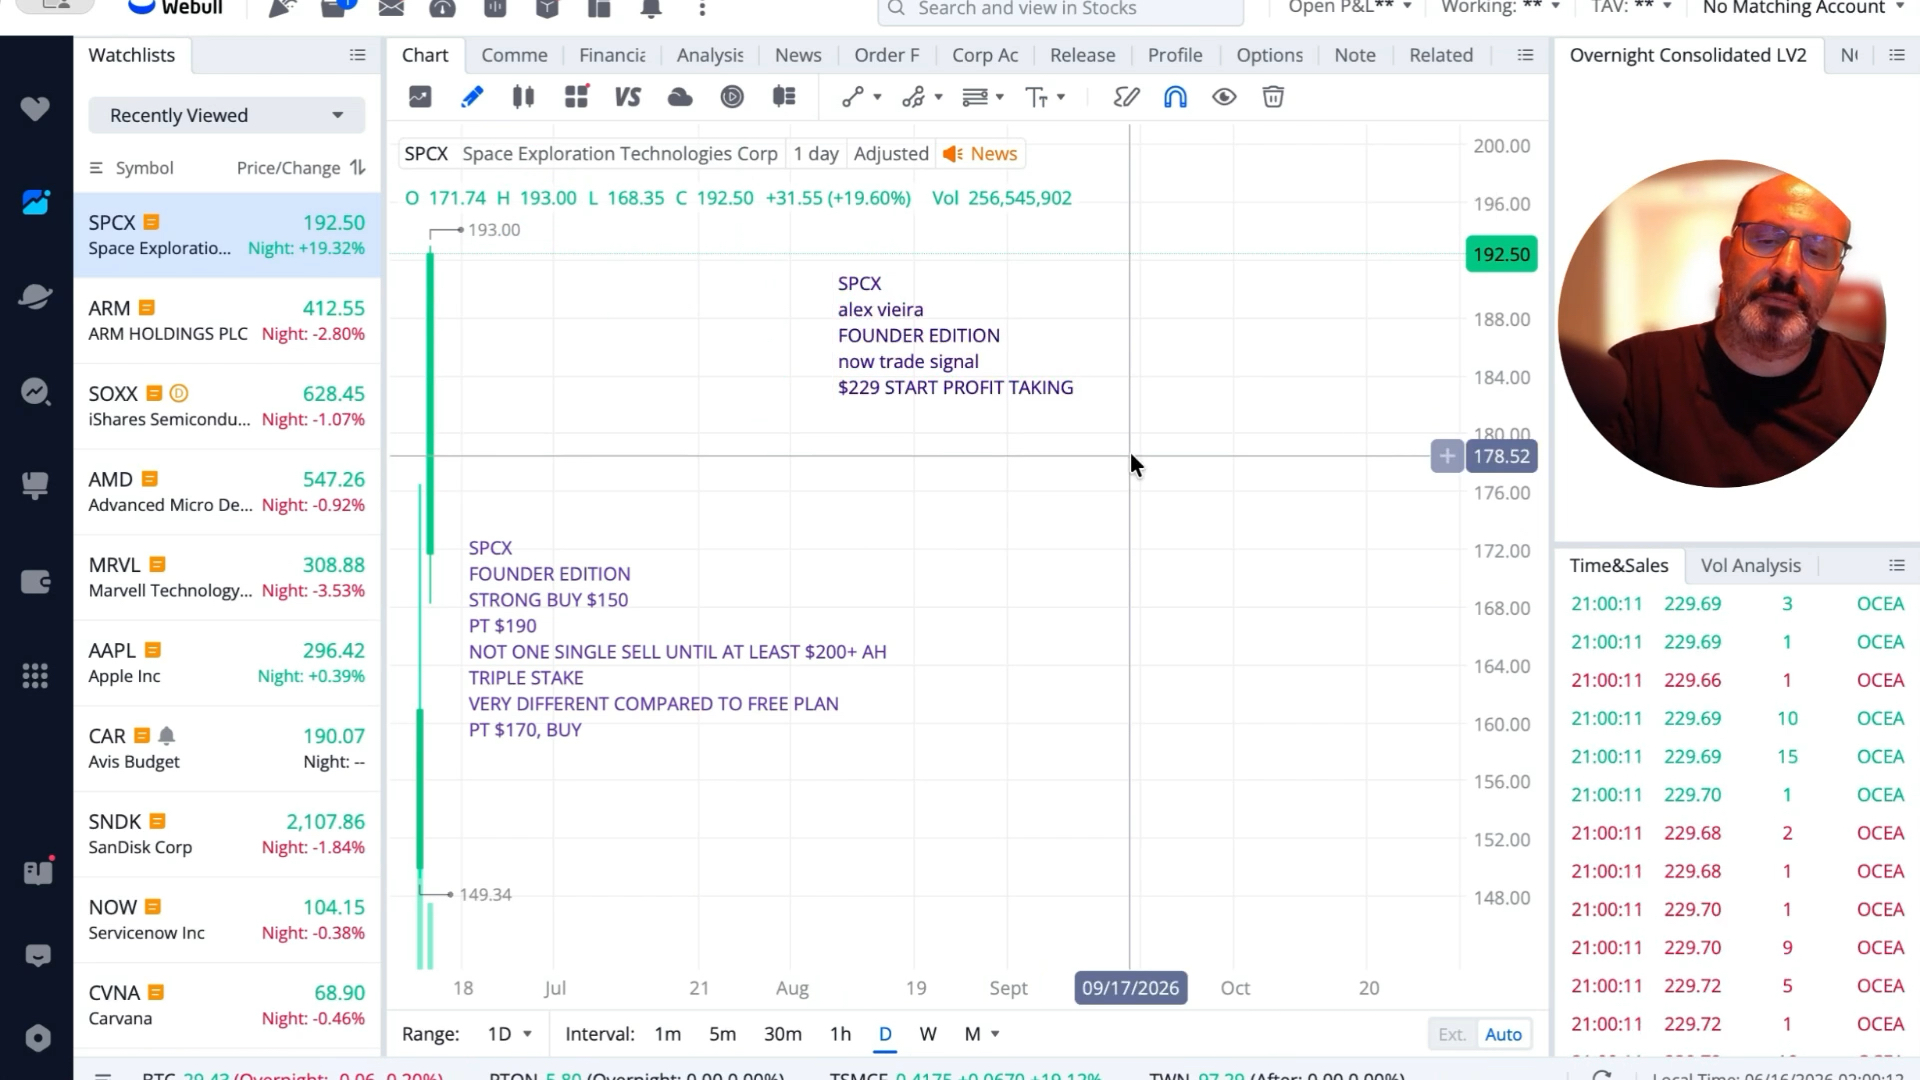
Historical case study — editorial context added 28 September 2026. Original claims and dates are preserved below. This is not a current signal or a representative performance result. The SpaceX cycle did not begin at $229. It began near the IPO zone around $150, continued through a Founder Edition triple-down accumulation framework, reached profit-taking near $229, and later declined to $172 after a public sell signal. While Wall Street projected $400, the algorithm completed the cycle and exited. Together, the June 12 and June 21 case studies document the entire SpaceX IPO trade cycle from entry to distribution. This case study should be read together with the preceding SpaceX IPO case study, which documented the accumulation phase from the $150 area through profit-taking near $229.
From $150 to $229 to $172 — The Complete SpaceX IPO Cycle.
← Back to Case StudiesVideo Evidence — SpaceX IPO Cycle, Top Call and Crash
This video documents the sell signal at $229, the decline to $172, and the completion of the broader SpaceX IPO cycle that began near $150.
This Case Study Continues the Prior SpaceX Cycle
The June 21, 2026 sell signal cannot be evaluated in isolation.
The preceding SpaceX case study documented:
- IPO accumulation near $150
- Founder Edition triple-down buy framework
- Target increase from $170 to $190
- Profit-taking near $229
This case study documents the next phase:
- Sell signal: $229
- Wall Street target of $400
- Decline to $172
Together, the two case studies form a complete IPO trade cycle from entry to exit.
Prior cycle: SpaceX IPO $150 to $229. Apple $316 to $288. Broadcom $489 to $370. Three Trades. 100% Accuracy.
Executive Summary
- IPO accumulation zone: $150 area
- Founder Edition accumulation: $155–$160
- Profit-taking: $229
- Sell signal: $229
- Wall Street target: $400
- Outcome: $172
- Challenge: $60M
- Published before price action
- Public timestamps
- Independently verifiable
The SpaceX stock sequence documents complete IPO cycle detection: accumulation near $150, Founder Edition accumulation at $155–$160, profit-taking at $229, a sell signal at $229, and a later decline to $172 while Wall Street maintained a $400 target.
The First Half of the SpaceX Cycle
- IPO accumulation near $150
- Founder Edition framework
- Target increases
- Accumulation before the move
The SpaceX cycle began with accumulation, not with the sell signal.
The first half is documented in SpaceX IPO $150 to $229. Apple $316 to $288. Broadcom $489 to $370. Three Trades. 100% Accuracy.
Founder Edition Triple-Down Accumulation
- Accumulation zone around $155–$160
- Founder Edition triple-down framework
- Strong Buy upgrade
- Target increase from $170 → $190
The Founder Edition framework expanded the SpaceX IPO forecast after accumulation in the $155–$160 zone and a target increase from $170 → $190.
Profit Taking at $229
- Cycle completion
- Profit capture
- Public publication
$229 represented the completion point of the prior SpaceX cycle.
Sell Signal at $229
- Top call
- Sell signal
- Risk removal
The algorithm transitioned from accumulation to distribution.
Crash to $172
- Decline after sell signal
- Completed downside move
- SPCX declined from $229 to $172
SPCX declined from $229 to $172 after the sell signal.
Wall Street Targeted $400
- Wall Street target: $400
- The algorithm exited at $229
- Two competing frameworks: price target narrative versus completed cycle detection
Wall Street projected $400 while the algorithm completed the cycle at $229.
Competitive Advantage: Detecting Both Sides of the Cycle
Most research platforms focus exclusively on upside forecasts.
The SpaceX sequence documented both sides of the same cycle:
- Buy near $150
- Triple-down accumulation near $155–$160
- Target increase to $190
- Profit-taking near $229
- Sell signal at $229
- Decline to $172
The competitive advantage was not identifying a bullish narrative.
The competitive advantage was identifying both accumulation and distribution before consensus shifted.
SpaceX IPO Forecast vs Wall Street Forecast
Algorithm
- Buy near $150
- Sell at $229
Wall Street
- $400 target
Outcome
- $229 → $172
The $60M Open Challenge
- Public challenge
- Public timestamps
- Independently verifiable record
The challenge is based on published signals and documented outcomes.
Why This Case Matters
The SpaceX IPO trade cycle includes entry, accumulation, profit-taking, sell signal, and decline. That matters because each phase was documented as part of the same SPCX cycle rather than isolated after-the-fact commentary.
The strength of the framework is not the buy or the sell in isolation. It is the complete cycle.
Trade Timeline
SPCX
IPO accumulation:
~$150
Founder Edition:
$155–$160
Target:
$170 → $190
Profit-taking:
$229
Sell signal:
$229
Wall Street:
$400
Decline:
$172
Verification
The record includes the source article, video evidence, the prior SpaceX case study, independently verifiable charts, public timestamps, and publication before price action. This is not hindsight.
Video reference: SpaceX $229 top call and crash to $172 video.
Source insight: Alex Vieira Calls SpaceX (SPCX) Top Selling at $229 Crash to $172, Wall Street Price Target $400 — $60M Open Challenge
Prior SpaceX cycle: SpaceX IPO $150 to $229. Apple $316 to $288. Broadcom $489 to $370. Three Trades. 100% Accuracy.
Related Content
Disclaimer
This content is provided for educational and informational purposes only.
Trading signals shown represent historical, documented outcomes and are not guarantees of future performance.
All trading involves substantial risk. Past performance does not indicate future results.
Conduct independent research and consider your risk tolerance before making investment decisions.